
Setting Up Cowrie Honeypot w/ Grafana Monitoring
-- views
Sep 12, 2025Step-by-step guide to setting up Cowrie honeypot and connecting it to Grafana for monitoring attack attempts and analyzing threat patterns.
Threat ResearchHoneypotDokploySelf-host
Preface
I've always wanted to build a honeypot and let attackers do their thing so I can understand what they actually do. I wanted to set one up where it's easily configurable to the point where it's harder to fingerprint and tell that it's actually a honeypot.
I've spent a few good hours just setting this honeypot up. Another few hours on just setting up Grafana alone as well.
Pre-requisites
In this setup, I had two cloud servers. The honeypot itself is hosted on a Google's always free cloud server. My Grafana dashboard and log aggregation (Loki) is setup on another cloud server via Dokploy.
Dokploy is recommended because it's what I'm using but a platform like Coolify may also work because of integration of Traefik.
You will also need a domain. I believe Dokploy's traefik-generated domains work but I am not sure. I haven't tested this.
Grafana/Loki
Grafana is what we'll be using as our dashboard to visualize logs sent from our honeypot. I chose Grafana because it has a very nice frontend! It's also very easy to setup with Docker since I'm deploying this on Dokploy.
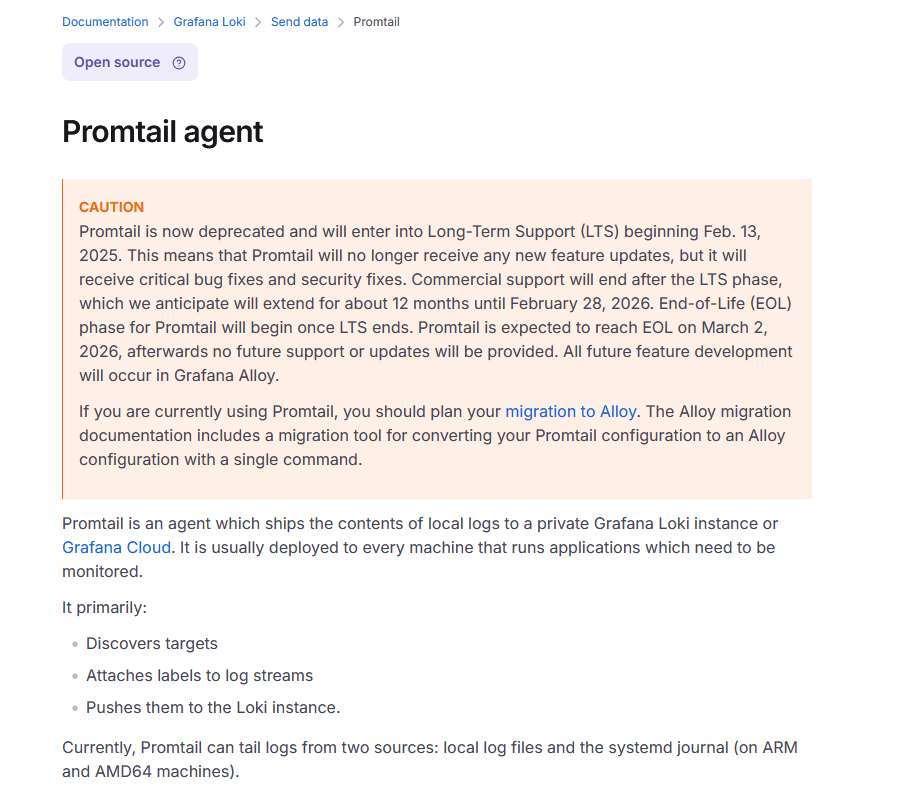
Loki is what I'm using to aggregate logs. It's connected to Grafana and logs are sent to Loki via Grafana Alloy (more about this later). Originally I was planning to send logs to Loki via promtail but it was being deprecated.
Setup #1
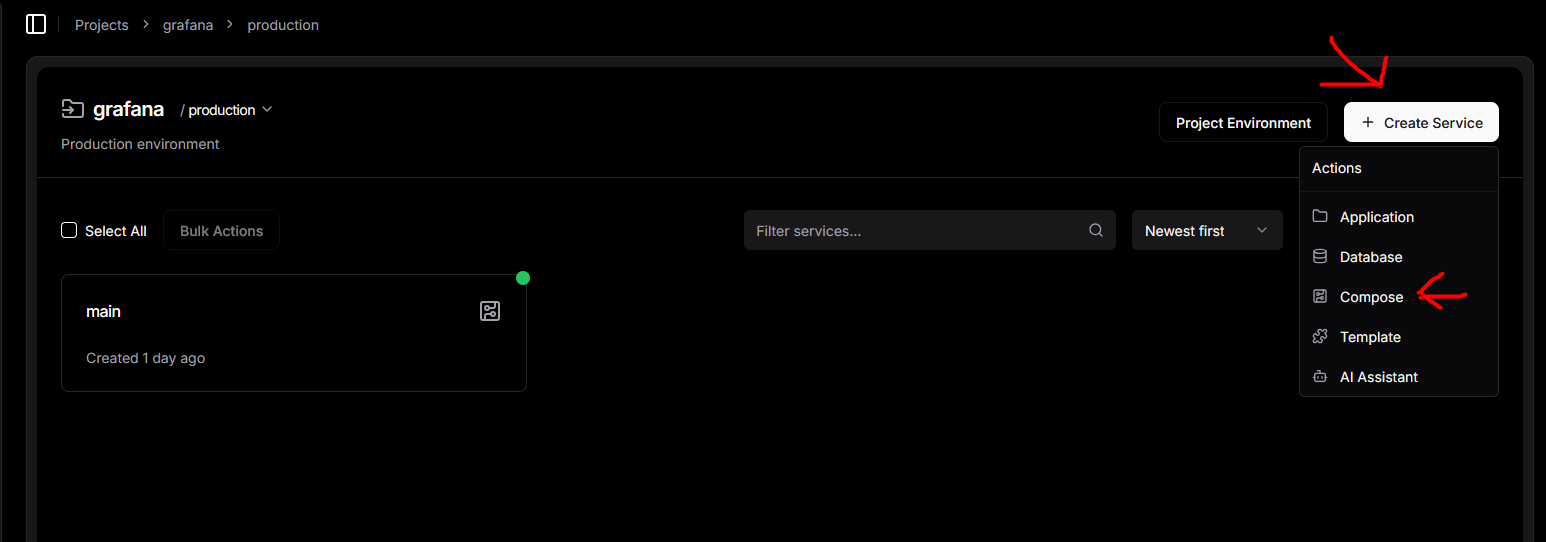
First, create a project in Dokploy. Name it anything. Then, go into the project and create a service and select "Compose"
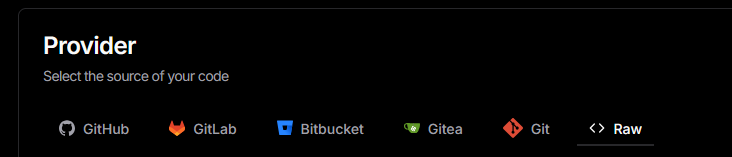
Name it anything. Then, make sure you've selected raw.
Paste this inside the text box:
yml
Replace "YOUR DOMAIN_1" with the domain you're planning to use for Loki. This is the domain where logs will be sent to from the honeypot. For example, for me it might be
loki.heybob.by or logs-aggregator.heybob.by.On the line for
- "traefik.http.middlewares.loki-auth.basicauth.users=<YOUR USER>:<YOUR HASHED PASSWORD>" you will be required to create a user and password. Refer to Traefik's Basic Auth documentation on how to create a hashed password. This will enforce HTTP auth on whatever domain you're planning to use for Loki so it prevents everyone from just sending data without authentication. Don't forget to save the original password used to hash!For "YOUR DOMAIN_2" this will be your domain where you'll access your Grafana dashboard.
Once you've setup your domain, you must setup Traefik:
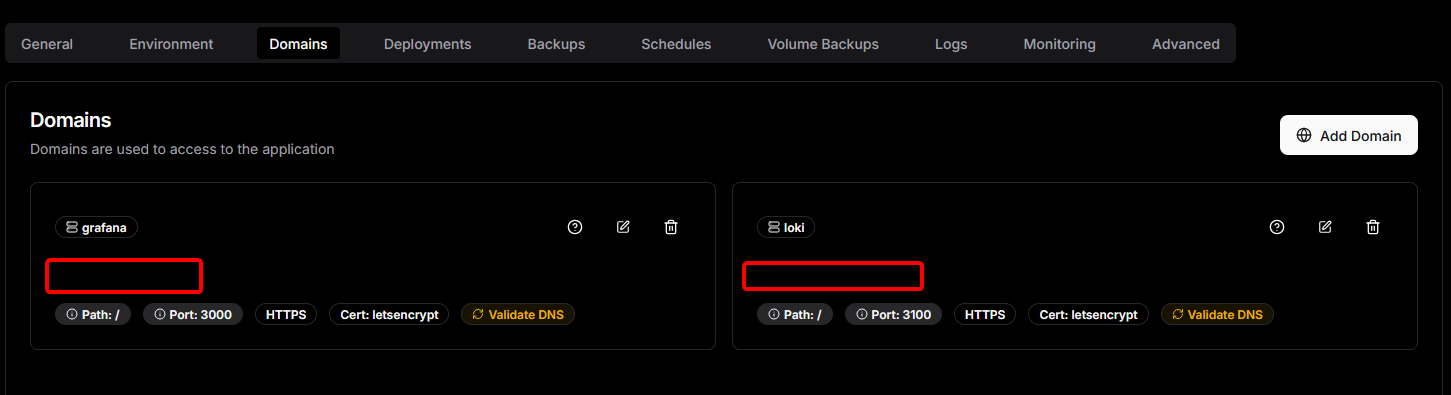
FYI, all of my domains configured for 1 & 2 are proxied through Cloudflare. You can do this too. I don't want my server IP getting exposed.
Under "Advanced", you will be required to create a persistent file for Loki's configuration file:
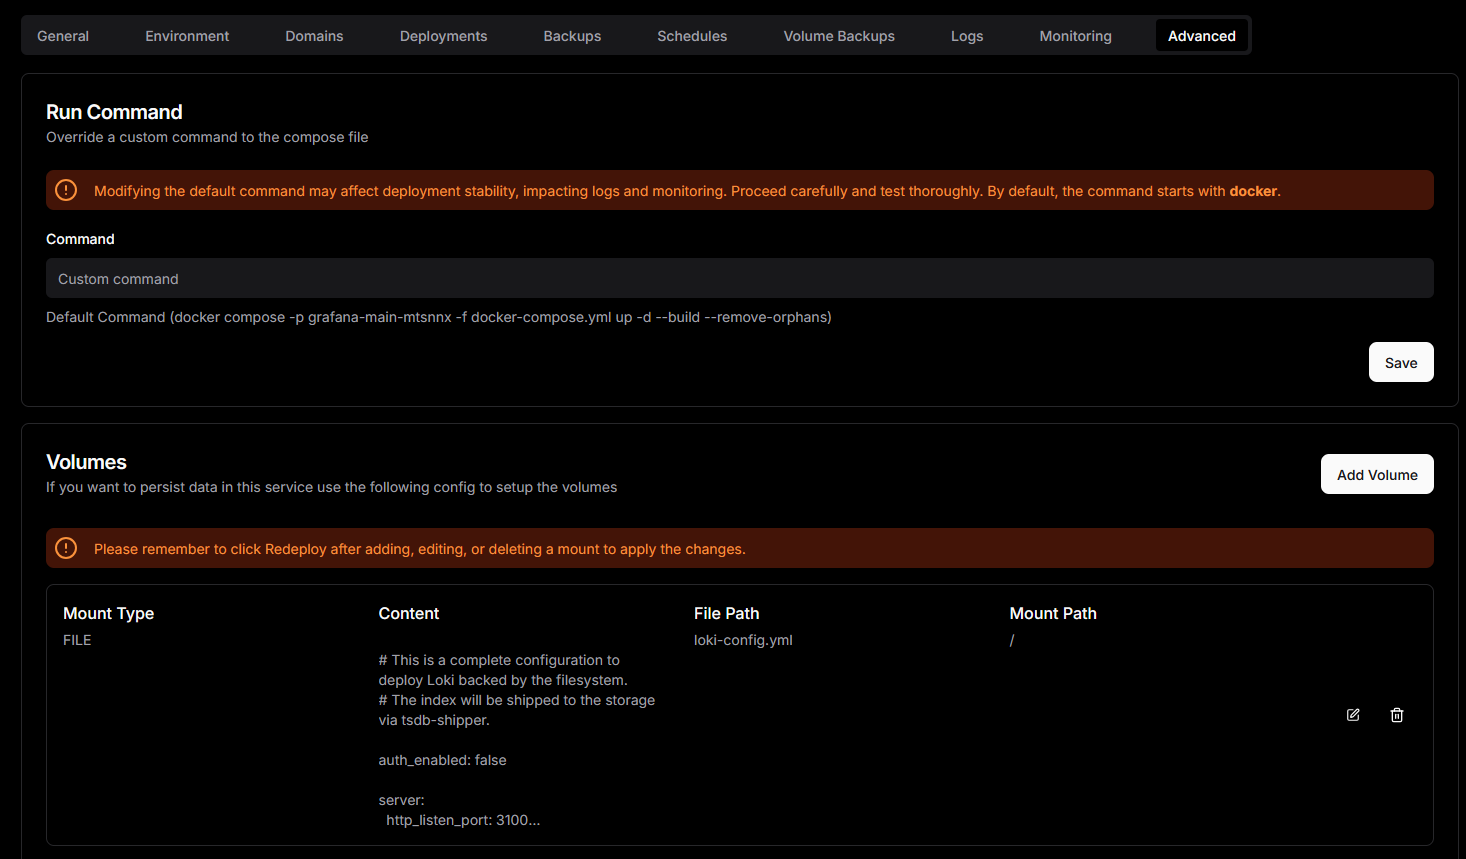
yml
Once that's done, deploy and you should be good to go. Access your Grafana dashboard at your domain and make sure you've changed passwords and everything. Once that's done, you will need to setup Grafana to communicate to Loki. This is straightforward.
Go to "Connections" -> "Add new data source" on top right -> filter by "Loki"
For connection, ensure that it's set to "URL" and the URL should be your Loki domain. For authentication, select "Basic Authentication" and enter the username and password you created earlier for Loki's HTTP auth. Then, save & test and that's it! It should be successful.
Cowrie/Grafana Alloy
Cowrie is our honeypot whereas Grafana Alloy is responsible for forwarding these logs to Loki.
In this setup, I've changed configurations pertaining to Cowrie. They are ultimately up to you, but do note that Telnet is enabled alongside several other changes (AuthRandom is set, honeyfs, etc).

Setup #2
Warning
You are expected to understand what a honeypot is. Be weary of hosting one in the first place!
Before installing anything, I changed my normal SSH port (22) to another port. This is to allow Cowrie to use port 22 as attackers would usually scan for 22.
This can be done by executing
sudo nano /etc/ssh/sshd_config then commenting out #Port 22 and changing 22 to another number.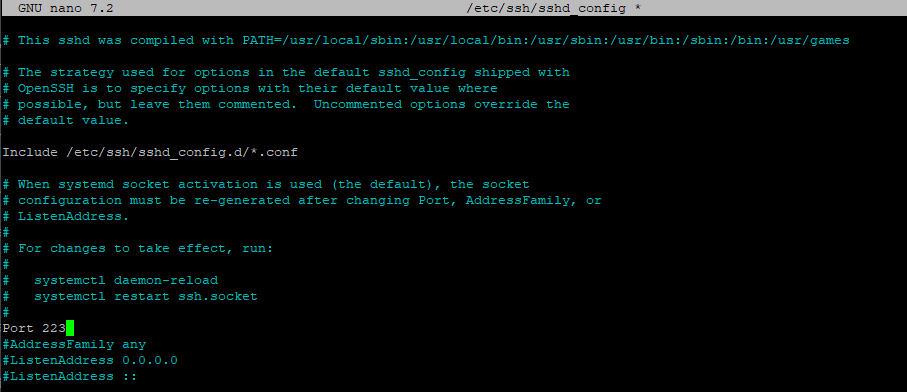
Once you've done that, just run
systemctl daemon-reload, systemctl restart ssh.socket, and then restart the server to test out the new SSH port.To continue, you will need to make sure you have:
- git installed
- docker installed
- python installed
In my Github repository, I've uploaded my own honeypot configuration that is meant to work with Grafana Alloy via docker compose.
git clone https://github.com/iamnotbobby/honeypot-config -> cd honeypot-configuration -> cd targetFrom here, you will need to configure Grafana Alloy (alloy-config.alloy):
txt
The password should be the plaintext password you created earlier. Once you've configured Grafana Alloy, you're set.
Note: I've also setup GeoIP so you should see IP addresses and their information within the logs.
Run
docker compose up -d and this will initiate Cowrie and Grafana Alloy at the same time.Return to your Grafana dashboard, navigate to "Logs", and you should see logs coming in.
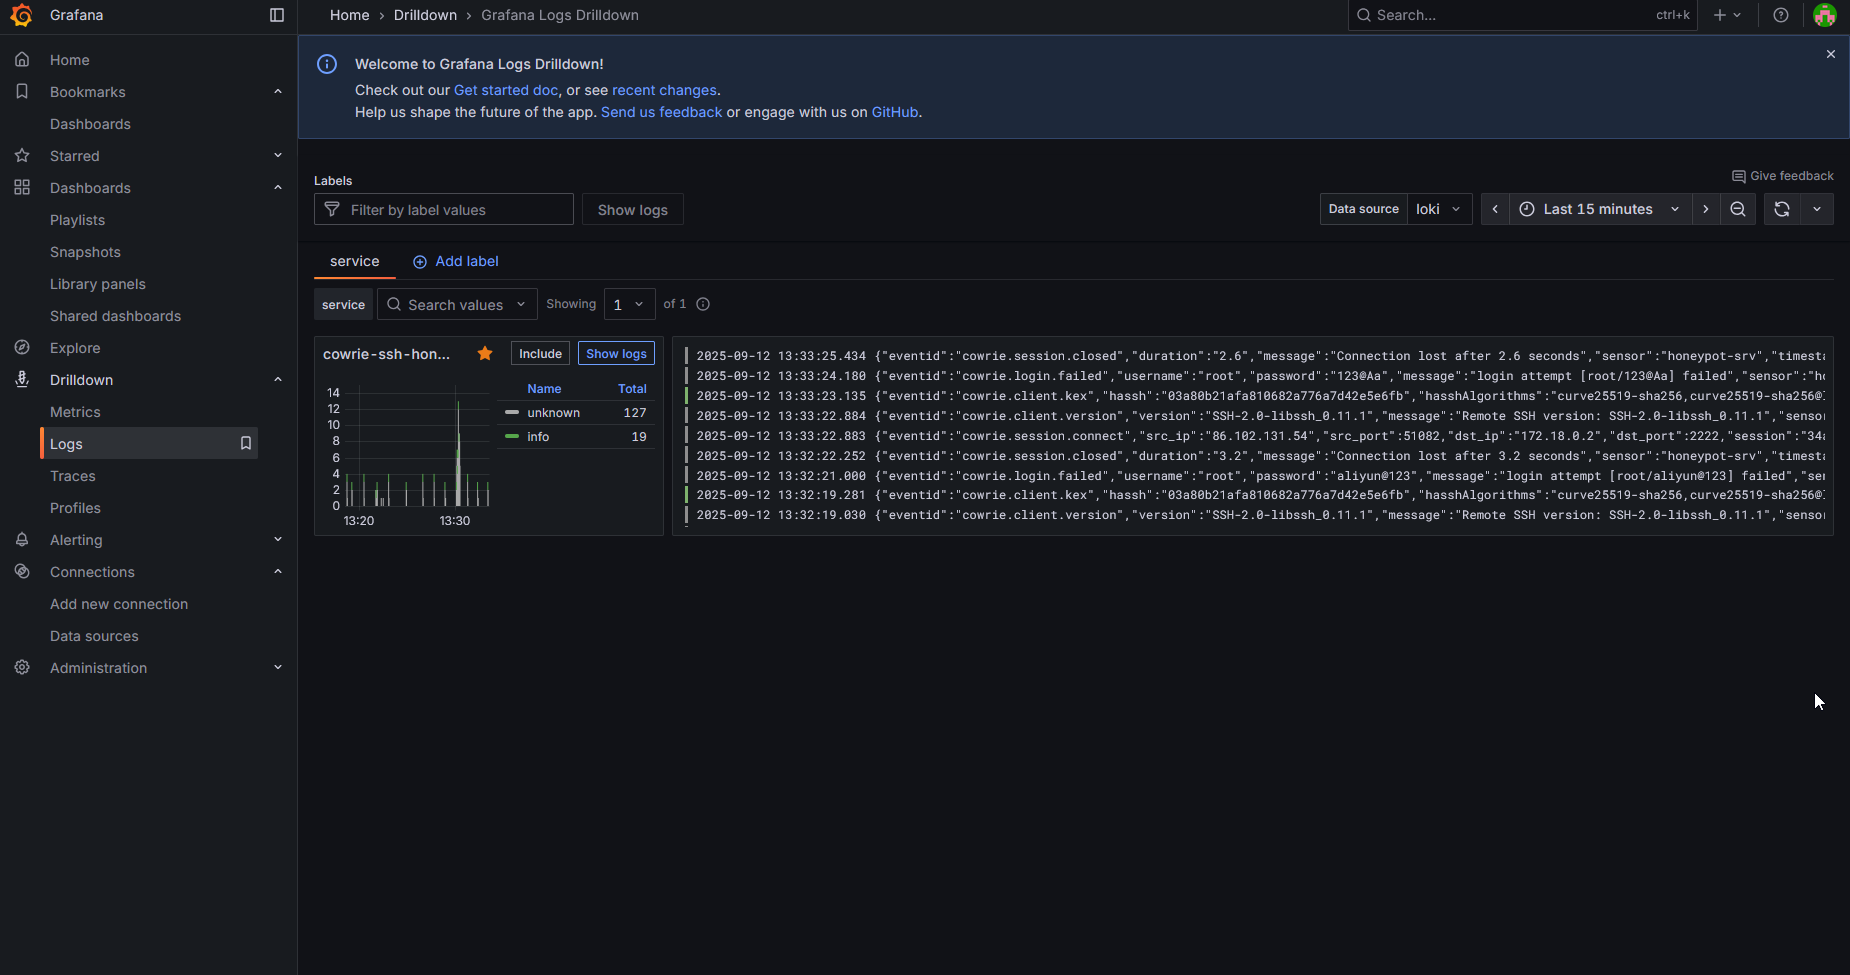
Note: I didn't include a tutorial on how to setup Grafana visualizations since I'm still a newbie stuff like this. You will have to create your own visualizations. I resorted to Claude/GPT for creating queries for my visualizations.
Configuring Cowrie
The process of configuring Cowrie in my setup is a bit convoluted since I'm running everything through Docker. You will have to refer to Cowrie's documentation for configuring Cowrie itself.
However, applying some of these configurations are a bit different. For example, if you wanted to create a pickle file you would need to run a Python script from the repository to do so. I'm under the assumption that this is intended for running Cowrie from source rather than in Docker. So in my repository, I've linked the actual Cowrie repository to mine so when you
git clone you should also be cloning Cowrie automatically.What this means is that when you want to create a pickle file, you can just run
python cowrie-development/src/cowrie/scripts/createfs.py -l honeyfs -o honeyfs/fs.pickle assuming you're in the /target directory.For modifying
honeyfs I've created a seperate directory under /target that is mounted to Docker.Conclusion
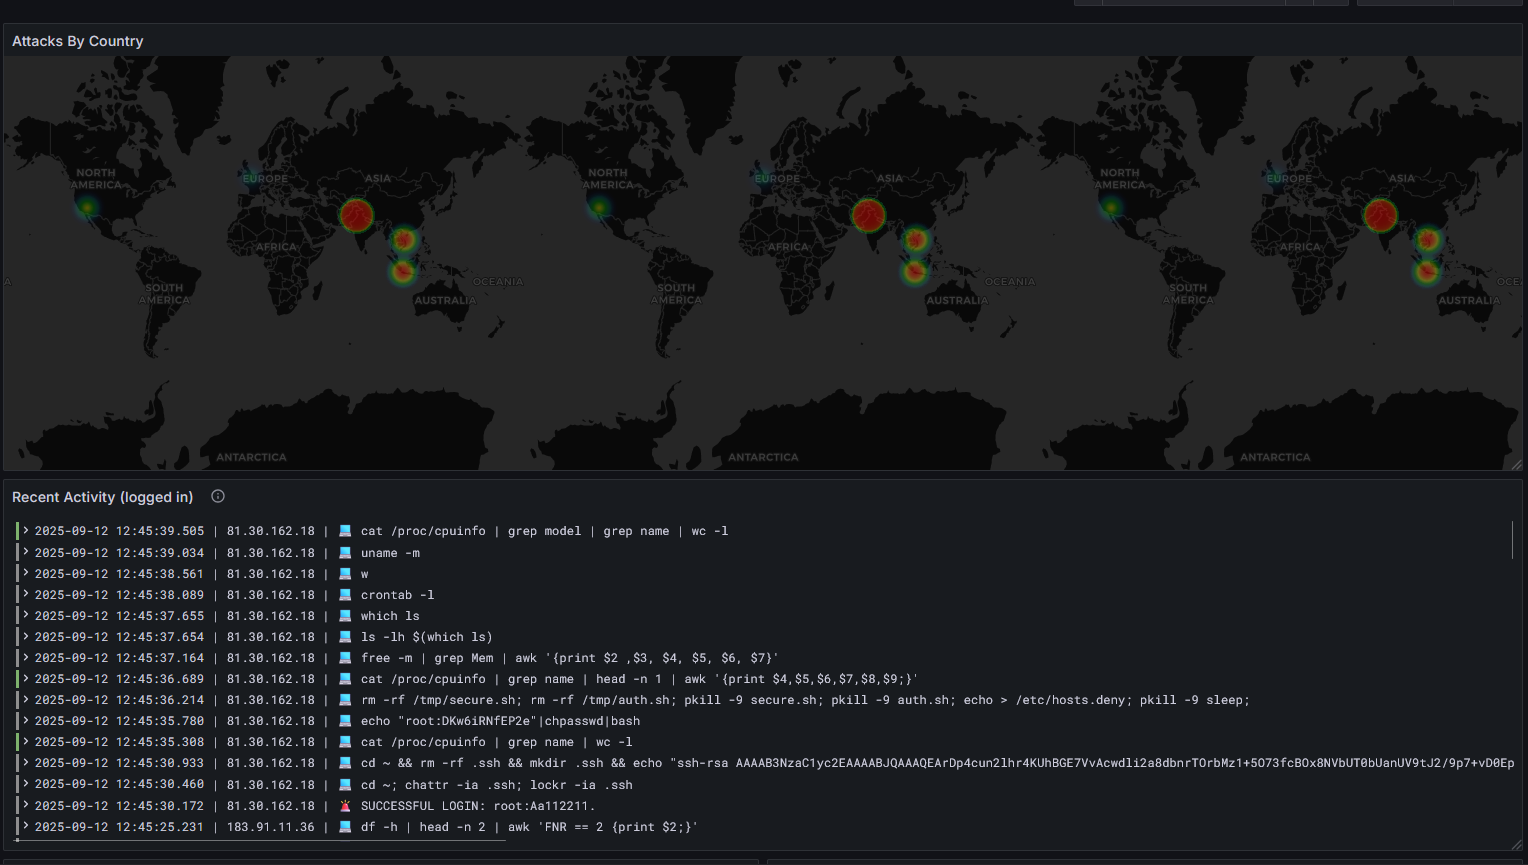
That concludes the setup. Since I've deployed this, I've gotten a lot of hits from various IP addresses. One of my visualizations included showing commands being used:
txt
Setting up a honeypot like this took me hours, but in the end it was absolutely worth the effort. The ability to set up a dashboard like Grafana and visualize attack trends in real-time is cooooool. What makes this even more cool is having a functional honeypot collecting threat data in the first place.
Maybe after this, I might focus on other attack vectors like websites. Thank you for reading though! If you have any questions, feel free to comment.